
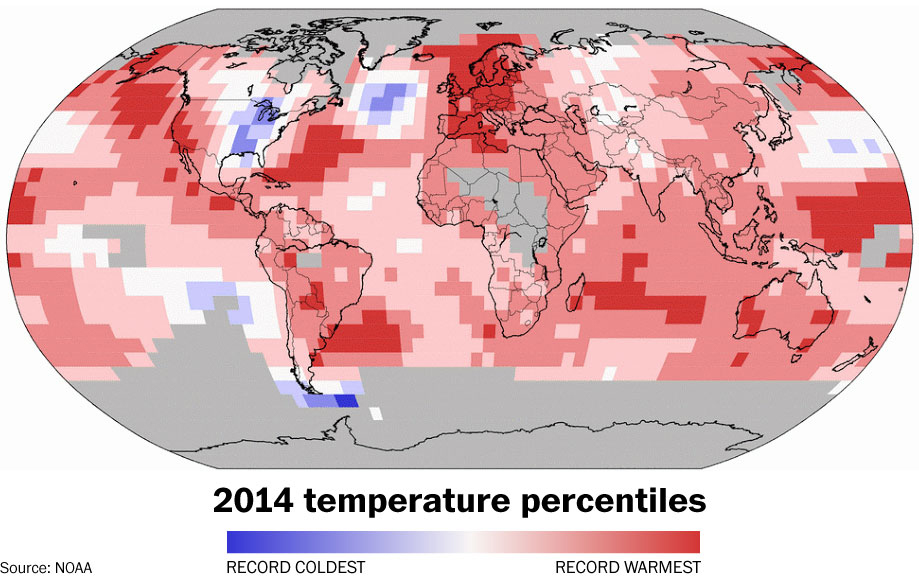
A National Oceanic and Atmospheric Administration illustration shows the 2014 temperature percentiles around the globe. Illustrates CLIMATE (category a), by Joby Warrick and Chris Mooney (c) 2015, The Washington Post. Moved Friday, Jan. 16. 2015. (MUST CREDIT: Photo for The Washington Post by NOAA)
