
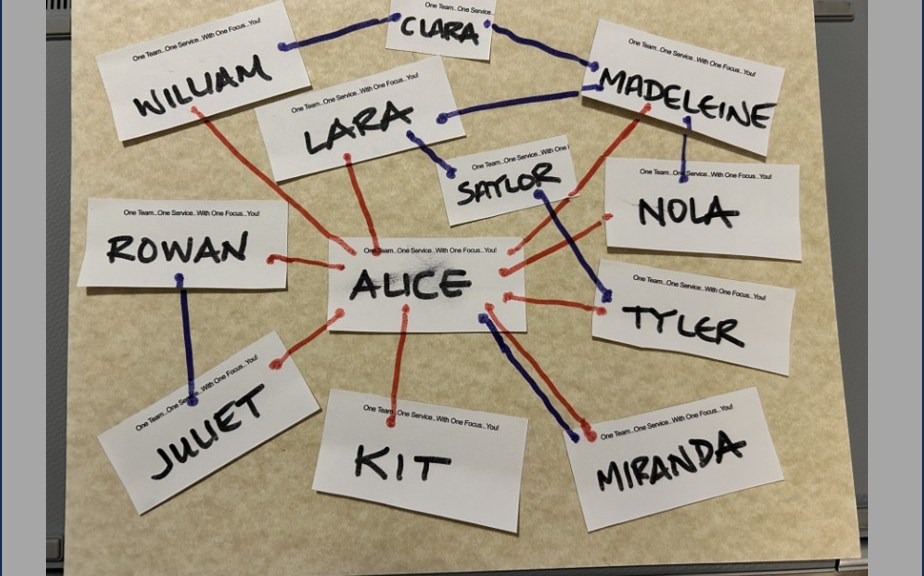
Over the weekend I finished No Two Persons by Erica Baumeister. It’s for my “other” book club. The author refers to it as a connected collection of short stories, but it really didn’t feel that way. Alice is the first character we meet – she is an author – and in the rest of the stories we meet those who read her book. Even though it was clear that it wasn’t a novel in the traditional sense, it felt like much more involved than a random group of short stories.
Even towards the beginning it seemed that the various people in the book were connected in more ways than just being readers. I was keeping track of them in my head and when I got finished, I realized I really wanted to see those connections on paper. So I pulled out my markers and post-it notes and made a chart. Nothing fancy, but it did the job. The two smaller post-it notes are fairly minor characters but since they both touched more than one life in the book, they got added. Miranda got two lines because she had a “give back” connection to Alice. I can’t say more without it being a big old spoiler alert.
Language in the book was wonderful; I really felt like I got to know each of the main characters and what was motivating them. None of the individuals felt stereotypical – Baumeister did a good job of making them real to me.
It was a pretty quick read because I was really drawn in from the beginning and I’m recommending it highly. 5 stars. Absolutely sure this will make the Top Ten list this year.
Do you like charts? Have a favorite kind? Pi charts? Venn diagrams? Bar charts? Scatter charts? Remember the last time you MADE a chart?


Now I feel bad for Kit. Nobody connects with him (her?).
I don’t have a feeling about charts. The ones I confront most often are family trees, my own and literary ones like the one at the front of A Hundred Years of Solitude.
Possibly I have never constructed a chart in my life.
LikeLiked by 3 people
Actually Kit’s story is great. He works in a bookstore and loves his life. Gets into a relationship that seems great to begin with but then he realizes that their basic personalities don’t mesh and ends it, not in a messy or cruel way. SPOILER ALERT… meets Alice in the bookstore and they end up together!
LikeLiked by 2 people
OK, Bill. Now that I’ve been thinking about it, maybe there should be a purple line back from Alice to Kit. Since they’re in a relationship by the end of the book, a long-standing relationship, it’s clear that they’ve given something to each other.
LikeLike
Now I feel better.
LikeLiked by 1 person
Is that your chart in the header photo?
LikeLiked by 2 people
Yep… just some post-its and markers. I did think about making it fancier or on the computer, but didn’t really want to make that big a whoo-hah out of it. I had five minutes of fun!
LikeLiked by 3 people
I had to do Venn diagrams in a math class. I’ve learned to hate them. Well, it’s complicated. I mean they’re interesting but as usual, once I started putting numbers into things it got hard. I think I like bar graphs.
LikeLiked by 2 people
Oh lordy, yes, I’m a chart person, though I’ll have to think for a bit about the last time I actually made one.
I enjoy the humorous (or not) Ven diagrams that come up on FB occasionally – will try to find one to post today…
LikeLiked by 2 people
Like Bill, I don’t really have any feelings about charts. I think I’ve tried to make one in the past, but apparently it wasn’t memorable. If I had to choose, I’d say pie charts for simple visual information and Venn diagrams.
Louise Erdrich includes family trees in her novels. I find them helpful. Many of her characters recur in her stories, so it’s interesting to get to know their families.
LikeLiked by 2 people
Medical MyChart is great.
Polling graphs, market charts are used daily. Sentence diagramming is done in my head. I hated graphing math equations.
LikeLiked by 2 people
Agree about medical mychart
LikeLiked by 1 person
I wonder about polling, though. I personally never respond to polls of any kind and I wonder who does and if they are really a representative sample.
LikeLiked by 2 people
I should probably learn to use this…
LikeLike
I do charts in spreadsheets. Tracking the performance of the retirement accounts, for example, and personal spending. I suppose I get a sense of control from watching the ups and downs.
LikeLiked by 2 people
Yes! One for books read and their authors, etc… keep track of mystery series, esp. the ones we read aloud.
LikeLiked by 1 person
Rise and Get Out the Post-Its, Baboons,
I like a Venn Diagram and I will use a few charts if it organizes information in a manner that I can consume it. I cannot say I am overly attached to it. And if you get me started on spread sheets I will probably roll my eyes and be very rude. Those tend to be utterly useless and difficult to operate. My experience is they rarely give me the information I need in a way I can make sense of it. Which I thought was the point. So negative emotions there.
Pause–answered the phone.
On the phone with a referral service. (I just had to request a list of services for husband. But they won’t tell me what kind of service might be needed so they can type that into their data-base/spread sheet. Therefore the service is completely useless and silly. That company must have a good marketer because they say they do something you can get with a simple internet search). Eyeroll. I am so huffy about this.
This is where pragmatism enters. If the chart is useful, I will use it. If it extraneous, silly pictures and “charts” that just confuses me, I do not like it. What is the point?
I love post-it notes. You can adapt those to a diagram that works and is useful to your reading. Perfect.
LikeLiked by 3 people
There’s a difference between charts you construct for yourself to clarify some information and charts someone else has devised to convince you of something. So much can be manipulated, like the time frame and the scale depicted to make a chart say just about whatever you want it to.
LikeLiked by 5 people
I used to make genograms, charts that diagrammed family relationship patterns in individuals and families I did therapy with. They were very helpful.
LikeLiked by 4 people
political guy that ran for president as an independent used charts so effectively I get frustrated when the politicians are talking about persons and hundreds of thousands of whatever and brilliant and billions of dollars I want to see it all on a chart and I think that people would understand that the 1% has 70% of the money tied up and the other 30% goes to the other 99% and they would share my frustration with the fact that when you make it percent and don’t illustrate the big picture you don’t get the idea. I use the Daisy chain kind of chart. I don’t know. Is that what they call a vent diagram to do lots of business stuff or this is related to that and I need to pull this in and I have that idea but I need to figure out how to tweak it with this that the next thing those church help me figure out what I’m looking at get a total picture. I appreciate charts rather than just having cold numbers out there. It’s always interesting to me. How you make a chart look like it’s going up big time but in reality you’re starting that number 120 and the turtle only goes up to number 125 so it doesn’t look like much but in reality there’s 120 at the one side and an infinite amount on the other side that isn’t getting charted so it’s interesting how ot relates
LikeLiked by 3 people
Would love to know what you were actually saying here,
when whatsit called) the recorder typed this out:
LikeLike
… voice recognition was the phrase I was seeking.
LikeLike
“…the next thing those church help me figure out what I’m looking at get a total picture”
(PJ would have enjoyed this interchange)
LikeLiked by 3 people
There are a bunch of funny Venn diagrams here:
https://pleated-jeans.com/2022/06/22/funny-venn-diagrams/
(Some are a tad raunchy.)
LikeLiked by 2 people
I think the Spanish inquisition was my favorite one. But a lot of them were very funny.
LikeLiked by 1 person
This isn’t a chart exactly, but when I move to a new place, I try and map out room arrangements by cutting little rectangles TO SCALE, and placing them in the layout of the house I’m moving to. It seems that I remember someone else on The Trail doing that too…?
LikeLiked by 1 person
… using graph paper…
LikeLiked by 1 person
Guilty
LikeLiked by 1 person